Screen of the Week 07/24/2013: Stocks with Upgraded Broker Ratings

by Kevin Matras
July 23, 2013

I’m sure we’ve all had the pleasure of waking one morning and seeing that a broker has upgraded one of our stocks. Usually that stock is in for a good day and possibly much more.

Unfortunately, we’ve probably all had the experience of waking up and seeing one of our stocks downgraded as well. Usually that stock is in for a rough day, and probably more days to follow.

And while nobody can perfectly predict an upgrade or guard against a downgrade, it’s important to know how the market reacts to these things, so you can stay in your upgraded winners (or buy if you’re on the fence) and consider getting out if a downgrade comes your way.

One thing I’ve been doing lately is screening for stocks that have recently seen a broker rating upgrade. Tests have proven that stocks with broker rating upgrades outperform those that don’t get upgraded. And they really outperform those stocks that get downgraded.

By how much?

I created three screens and ran some tests over the last 10 years. And I applied all the below criteria to stocks trading greater than or equal to $5 with an average daily trading volume of greater than or equal to 100,000.

In screen 1: I backtested only those companies with broker rating upgrades.

In screen 2: I tested companies with no rating change at all. Whatever the rating was, good or bad, there was no change.

And in screen 3: I screened only those companies that received broker rating downgrades.

The tests pretty much confirmed what I had already suspected – but the magnitude was a lot larger than I thought.

The broker rating upgrades over the last 10 years showed an average annual return of 10.4%.

The ones with no rating change at all showed an average annual return of 6.1%.

And the stocks with broker rating downgrades actually showed a loss of -0.3%.

So the upgrades beat the ones with no rating change by nearly twice as much. And they outperformed those with downgrades even more. In fact, that was the difference between making money and losing money.

Below are 5 stocks that have all been upgraded within the last 4 weeks (for 7/23/13):

(HLSS) Home Loan Servicing Solutions, Ltd.
(HUM) Humana Inc.
(MDVN) Medivation, Inc.
(NTAP) NetApp, Inc.
(SNDK) SanDisk Corp.

Get the rest of the stocks on this list and sign up for your free trial of the Research Wizard. Start using this idea in your own screens and start putting your own ideas to the test. It’s easy to do and you’ll be on your way to picking better stocks immediately.

Learn how today with the Research Wizard.

Disclosure: Officers, directors and/or employees of Zacks Investment Research may own or have sold short securities and/or hold long and/or short positions in options that are mentioned in this material. An affiliated investment advisory firm may own or have sold short securities and/or hold long and/or short positions in options that are mentioned in this material.

Disclosure: Performance information for Zacks’ portfolios and strategies are available at: http://www.zacks.com/performance.

Get the full Analyst Report on SNDK – FREE
Get the full Snapshot Report on NTAP – FREE
Get the full Analyst Report on MDVN – FREE
Get the full Analyst Report on HUM – FREE
Get the full Snapshot Report on HLSS – FREE

Screen of the Week 06/18/2013: Your Next Stock Should Be Making New Highs

by Kevin Matras
June 18, 2013

Today I’m going to go over a simple screen with a powerful concept. Buying stocks making new highs.

I know some are reluctant to buy stocks making new 52 weeks highs. If you’re one of them, have you ever asked yourself why?

If a stock is making a new 52-week high, that’s a good thing. Especially now.

I’m pretty sure that a person who dislikes buying stocks making new 52-weeks highs wouldn’t be too upset if the stock he already owned broke out to new 52-week highs.

And why should he? Statistics have shown that stocks making new highs have a tendency of making even higher highs.

These are the stocks we all dream about. Get in and it keeps going up.

Of course the fundamentals need to be there. And you should keep a watchful eye on valuations. But if you were in a stock making new highs and cheering it on, it seems silly to be afraid of one doing the same just because you haven’t bought it.

One question I like asking myself just to put things into perspective is: if I was in it, would I be excited and would I still want to be in it? If the answer is yes, then I’ll look for the best opportunity to get in.

This topic actually reminds me of a question someone asked me a while ago about a stock I was talking about that was at a new 52-week high. In fact, it was at a new 5 year high.

He said aren’t you worried about buying a stocks at a 52-week high? I said of course not. So it just made a new-52 week high. That’s great news. Guess what — last year it made a new 52-week high as well. And the year before that. And the year before that.

Can you imagine all the money you’d be leaving on the table if you were afraid of being in stocks every time they made a new high?

The screen I’m running today looks for:

Stock trading within 10% of their 52 week high. The expression looks like this:

Current Price/52 Week high greater than or equal to .90

That means these stocks are either at a new 52 week high, or have just hit it and still trading within 10% of it, or are climbing towards their 52 week high and are within striking distance.

Zacks Rank less than or equal to 2

Only Zacks Strong Buys and Buys.

Price to Sales less than or equal to 1

A Price to Sales ratio of 1 means you’re paying $1 for every $1 of sales a company makes. A P/S ratio of less than 1 means you’re paying less than $1 for every $1 of sales a company makes. I have found that by looking at stocks with a P/S ratio of less than or equal to 1 helps me find stocks that are still considered undervalued -– even if they are making new highs.

Current Avg. 20 Day Volume greater than Previous week’s Avg. 20 Day Volume

In short, this helps me find stocks where the volume has increased in the recent week vs. the previous week. If the price is climbing on increased volume, that shows increased demand or buying coming in. And the more buying demand there is for a stock, the more it should climb.

All of these parameters are applied to stocks greater than or equal $5 with Avg. daily volume of greater than or equal to 100,000.

Here are 5 stocks that made it thru this week’s screen:

(ADUS) Addus HomeCare Corp.
(AMWD) American Woodmark Corp.
(BLMN) Bloomin’ Brands, Inc.
(MGA) Magna International Inc.
(OMG) OM Group Inc.

Sign up now for your 2 week free trial to the Research Wizard and get the rest of the stocks on this list and start using this screen in your own trading. Or create your own strategies and test them first before you invest. Know what to buy and when to sell. You can do it.

Learn how today.

Disclosure: Officers, directors and/or employees of Zacks Investment Research may own or have sold short securities and/or hold long and/or short positions in options that are mentioned in this material. An affiliated investment advisory firm may own or have sold short securities and/or hold long and/or short positions in options that are mentioned in this material.

Get the full Snapshot Report on OMG – FREE
Get the full Analyst Report on MGA – FREE
Get the full Snapshot Report on BLMN – FREE
Get the full Snapshot Report on AMWD – FREE
Get the full Snapshot Report on ADUS – FREE

Earnings Preview 05/31/2013: Banks Pulling Up Estimate Revisions

by Sheraz Mian
May 31, 2013

The Q1 earnings season is effectively over and we still have a few more weeks to go before the next reporting cycle gets underway. The focus this week is on economic data, particularly the jobs report coming on Friday.

A handful of 2013 Q1 results are still awaited and quite a few of those will come out this week. Including Dollar General (DG – Snapshot Report), VeriFone (PAY – Analyst Report), J.M. Smucker (SJM – Analyst Report), Hovnanian Enterprises (HOV – Snapshot Report) and others, we will get Q1 results from 51 companies in total and 4 S&P 500 members. We are nearing the end point of Q1 earnings season and just a couple of weeks away from the point when the Q2 earnings season gets underway with reports from Discover Financial (DFS – Analyst Report) and Oracle (ORCL – Analyst Report) on June 17th.

Expectations for the 2013 Q2 earnings season have come down, with total earnings in the quarter now expected to be up +0.9% on -0.7% lower revenues. This is a drop from the +3.9% total earnings growth expected in Q2 on +0.5% higher revenues in early April. Total earnings were up +2.8% in Q1 on barely positive growth in revenues.

The Finance sector is expected to rebound strong in Q2, with total earnings for the sector expected to be up +19.1% from the same period last year after the +7.7% total earnings growth in Q1. The recent uptrend in long-term interest rates following the ‘Taper’ buzz has improved the operating backdrop for the sector quite a bit, with earnings estimates for the sector moving up. As you can see in the ‘revisions ratio’ charts below, the revisions trend is decidedly in the positive category for the sector.

Expectations for full-years 2013 and 2014 have come down far less than what we have seen for Q2 estimates. In fact, it is reasonable to assume that given the improving outlook for the Finance sector, aggregate estimates will start rising after a very long time in the coming weeks.

The +6% growth in total earnings this year, down from +6.8% in early April, reflects a material ramp up in the second half of the year that is then expected to carry into 2014. Combining the actual results for Q1 with estimates for Q2 gives us +1.8% year over year growth in total earnings in the first half of 2013. But total earnings are expected to be up +9.5% in the second half of the year and a further +11.5% in full-year 2014.

For a quick recap of the Q1 earnings season, please check this video . This Earnings Trends report provides a detailed look at the earnings picture.

Trends in Estimate Revisions

The revisions trend has started moving in a positive direction, with more earnings estimates going up instead of down. Even accounting for the typical seasonal behavior of revisions activity which peaks during earnings seasons and tails off after the season is over or close to over, the emerging trend in revisions appears significant.

The charts below show trends in earnings estimate revisions. The key metric in all the charts is the ‘revisions ratio,’ which is the ratio of total number of upward revisions over the preceding four weeks to the total number of revisions (positive and negative) over that same period. We have two charts each 2013 and 2014. The bar charts show the current state of the ‘revisions ratio’ (as of 5/24/13), while the line charts plot the ratio’s trajectory over the preceding 24 months.

Charts

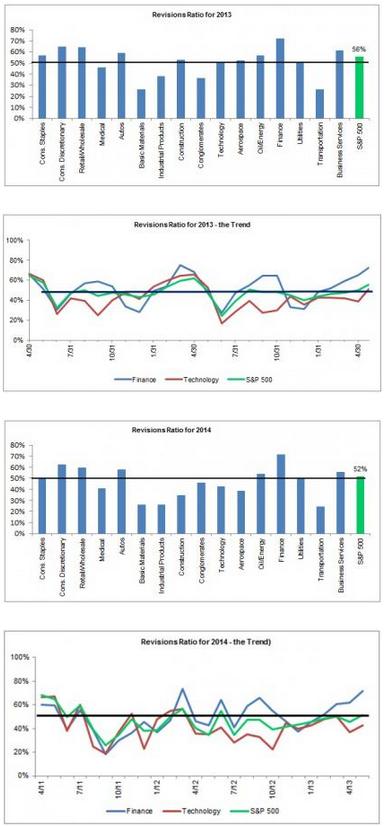
The ratio doesn’t tell you the ‘magnitude’ of the revisions, only the direction. The ‘50%’ level (the dark line) is the dividing line between positive and negative trends, with readings above 50% implying more positive than negative revisions. Our analysis shows that readings between 45% and 55% don’t offer material insights into the magnitude of revisions. It is only readings above 55% and below 45% that offer bullish and bearish signals about the magnitude of earnings revisions.

As you can see in the charts above, the revisions trend for the S&P 500 as a whole is still in neutral territory though moving in the right direction. But see the fast emerging positive trend in the Finance sector for both this year and next (the green line). The sector’s revisions ratio currently (as of 5/24) stands at 72%, by all means bullish territory. This pronounced positive bias is at play for many industry players that are experiencing positive estimate revisions, including J.P. Morgan (JPM – Analyst Report), Wells Fargo (WFC – Analyst Report), Fifth Third Bank (FITB – Analyst Report) and many others.

The trend makes perfect sense as higher interest rates may be a hindrance for other industries, but it’s beneficial for the Finance sector’s earnings. Flat net-interest margins have been a permanent feature of the sector’s — particularly banking’s — earnings picture in recent quarters. The charts also show the trend in the Technology sector, the largest in the S&P 500, to spotlight Finance’s improving outlook.

The Finance sector’s positive earnings outlook is a function of the rising trend in interest rates. But whether that trend continues or reverses course in the coming days will depend to a large extent on economic data this week, particularly Friday’s May non-farm jobs report. A positive jobs report on Friday will significantly increase the odds of a ‘Taper’ announcement in the coming FOMC meeting.

The market’s anticipation of the Fed’s plans to taper its monthly bond purchases has been the primary driver pushing bonds yields higher. There is plenty of other economic data coming out this week as well, including the two ISM surveys, motor vehicle sales numbers, Construction Spending and the Fed’s Beige Book.

Monday – 6/3
The May Manufacturing ISM survey will be the key report today, though we will also be getting the April Construction Spending and the May motor vehicle sales numbers.

The expectation is for the ISM reading to come in at 51.7 after the 50.7 reading in April, but the strong showing by the Chicago PMI improves the odds of a positive surprise here. A strong ISM reading will be interpreted as a net negative by the market given its recent ‘Taper’ fixation.

ABM Industries (ABM), Cracker Barrel (CBRL) and SAIC (SAI) are the only notable reports today.

Tuesday – 6/4
The April Trade Deficit is the only economic report on the docket, with expectations of an increase from March’s $38.8 billion deficit level.

Dollar General (DG – Snapshot Report) and American Woodmark (AMWD) are the key earnings reports today, both in the morning.

Wednesday – 6/5
A very busy day on the economic calendar, with the May ADP jobs report and Q1 productivity readings coming out before the market’s open. Also coming out today are the Non-manufacturing ISM report for May, the April Factory Orders report, and the Fed’s Beige Book.

The consensus expectation is for the ADP report to show 183K private sector jobs, up from April’s 119K level. A strong ADP report will set market expectations for the Friday jobs report from the government’s Bureau of Labor Statistics (BLS).

Brown Forman (BF.B), Hovnanian Enterprises (HOV – Snapshot Report) are the only notable earnings reports in the morning, while VeriFone (PAY – Analyst Report) will report after the close.

Thursday – 6/6
The weekly Jobless Claims numbers coming out this morning are expected to show a reversal of the prior week’s jump in initial claims.

J.M. Smucker (SJM – Analyst Report) and Titan Machinery (TITN) are the key reports in the morning, while Cooper Companies (COO) will report after the close.

Friday – 6/7
The May non-farm payroll report from the government’s BLS is the day’s highlight and will set the tone for the stock market not just for today, but also for the coming days. The expectation is for a ‘headline’ tally of 175K jobs after April’s 165K tally. A strong jobs report will be a negative for the market.

Screen of the Week 05/28/2013: The Right Way to Find Growth and Value Stocks

by Kevin Matras
May 28, 2013

Especially now, with concerns over slowing growth and rich valuations.

And while there are still plenty of companies out there with great growth rates and attractive valuations, it’s getting harder to find stocks that fit squarely into both categories.

First off, Growth Investors focus on companies with great earnings growth. And this makes sense since earnings drive prices. But nobody wants to overpay for good growth.

Value Investors focus on low valuation metrics, like low P/Es for example. But many companies have low P/Es because they don’t have any real growth to speak of. They lack earnings power. And people aren’t willing to pay up for these stocks because there’s nothing to pay up for.

But looking for both growth and value is a great combination and helps alleviate the pitfalls of having one but not the other.

But I believe there’s a right way and wrong way to find both growth and value stocks.

What I mean is this:

Most will start off with either one or the other. Like looking for stocks with the biggest growth rates first, and then narrowing those stocks down to the ones with the smallest P/E ratios.

But if the biggest growth rate stocks all had high P/E ratios (let’s say in excess of 20 or more, for example) are you really finding the best of the value stocks? The answer is no. You’re only finding the growth stocks with the lowest valuations – even though they may be quite high.

Likewise, if you first screened for the lowest P/E ratios, and then narrowed that list down to the ones with the biggest growth rates – if the lowest P/E stocks all had sub-par growth rates – you’d only be selecting the best of the sub-par growth stocks and not really getting both the growth and value you were looking for.

Some try to overcome this by plugging in classical metrics like P/E under 20 and growth rates over 20. But you’ll have a ton of stocks filling up that list and you’ll be digging thru a ton of average stocks, not the best of each category.

So how does one find these stocks the right way?

I do it by using a uniform ranking on both categories.

And that’s the focus of this week’s screen.

It focuses on companies with the highest growth rates AND the lowest P/E ratios ALL AT THE SAME TIME.

Let me explain.

The screen starts off by looking at:

Companies with one year Projected Growth Rates in the top 20 percentile of all companies.

(Using a Uniform Rank of 1-99 (99 being the best growth rates), I screened for stocks ranked 80 or better, meaning better than 80% of all the other companies out their in terms of growth rates.)

Companies that also happened to have the lowest forward (F1) P/Es – lower than 80% of all other companies.

(Again, using a Uniform Rank of 1-99 (this time 99 having the lowest P/Es), I screened for stocks ranked 80 or better, meaning companies with P/Es lower that 80% of all the other companies out there.)

They all have to have a Zacks Rank of 2 or less.

(Meaning no ‘Holds’, ‘Sells’ or ‘Strong Sells’ allowed.)

And this was all applied to stocks trading at or above $5, with average daily trading volumes of 100,000 shares or more.

So with this screen, we’re not starting with one and then looking for the other. The order of the above parameters is irrelevant. If I switched it around, I’d get the same stocks.

Because essentially I’m demanding that the companies have to have BOTH growth rates AND valuations in the 80th percentile, i.e., better than 80% of all the other stocks out there. And better on each category.

By the way, for those trying to do this on their own at home, here’s what the screen looks like. The uniform ranking was done in the calculation expression feature in the Research Wizard.

The Right Way to Find Growth and Value Stocks.

This screen also comes pre-loaded with the Research Wizard and it’s called sow_growth and value.

Below are 5 stocks that made it thru this week’s screen:

(ECPG) Encore Capital Group, Inc.
(HCI) Homeowners Choice, Inc.
(LEA) Lear Corp.
(MGA) Magna International Inc.
(RDA) RDA Microelectronics, Inc.

Each one of these stocks (and all of the stocks on the entire list), have market-beating growth rates with below market P/E values. A great combination.

Check it out for yourself and get the rest of the stocks on this list. See where your stocks Rank out of all of the other stocks out there, and test your own strategies and see how they’ve done. Find out what works and what doesn’t. It can all be done with the Research Wizard stock picking and backtesting program.

Sign up now for your two week free trial and learn how.

Disclosure: Officers, directors and/or employees of Zacks Investment Research may own or have sold short securities and/or hold long and/or short positions in options that are mentioned in this material. An affiliated investment advisory firm may own or have sold short securities and/or hold long and/or short positions in options that are mentioned in this material.

Disclosure: Performance information for Zacks’ portfolios and strategies are available at: http://www.zacks.com/performance.

Read the full Snapshot Report on RDA
Read the full Analyst Report on MGA
Read the full Snapshot Report on LEA
Read the full Snapshot Report on HCI
Read the full Snapshot Report on ECPG

Earnings Preview 05/03/2013: Q1 Earnings Season in Final Stretch

by: Sheraz Mian

We still have plenty of Q1 earnings reports to come, but the bulk of the earnings season is now behind us, with results from 405 S&P 500 companies already out as of Friday, May 3rd. The Retail sector is the only one where more than half of the sector’s total market capitalization has yet to report Q1 results.

For the remaining sectors, the reporting season has ended for 3 – Autos, Construction and Aerospace. For 6 of the 16 Zacks sectors, we have Q1 results for 95% or more of the sector’s total market cap.

This week is the last major reporting week of the Q1 earnings season, with results from 625 companies, including 46 S&P 500 members. This includes industry leaders like Disney (DIS), News Corp (NWSA), Priceline (PCLN), Whole Foods (WFM), Groupon (GRPN) and many others. By the end of this week, we will have Q1 earnings reports from 451 S&P 500 companies. The Retail sector will be the only group by the end of the week that will have more than half of its Q4 results still awaited (retailers typically have fiscal Q4 period-ends in January).

We continue to grade the Q1 earnings season as between ‘average’ and ‘below average’ – it’s definitely neither ‘good’ nor ‘bad.’ This isn’t materially different from what we have been seeing over the last few earnings seasons. What this means is that about two-thirds of the companies beat earnings expectations, but growth is essentially non-existent. A key difference relative to 2012 Q4 earnings season is the very low level of positive revenue surprises.

The Q1 Earnings Scorecard

Total earnings for the 405 companies are up +2.9%, with 67.2% of the companies beating earnings expectations with a median surprise of +3.3%. Revenues are down -1.3%, with only 40.7% of the companies coming ahead of top-line expectations, with a median surprise of (negative) -0.4%.

The earnings growth rate and ‘beat ratio’ for these 407 are comparable to what these same companies reported in 2012 Q4 and the last few quarters. But the revenue growth rate and ‘beat ratio’ is lower, with the beat ratio particularly weak in the current period.

In addition to the revenue weakness, another notable aspect of the Q1 earnings season has been the soft Technology results. The sector’s growth rates and ‘beat ratios’ are weaker than those for the S&P 500 as well as the group reported in 2012 Q4. With 83.4% of the sector’s total market capitalization already out with Q1 results, total earnings for the sector are down 5.2%, with 58% of the sector companies beating earnings expectations (vs. the S&P 500 average of 67.2%). The revenue side for the sector isn’t that bad (up +4.3%), which goes on to spotlight the sector’s margin problems.

The aggregate earnings picture for the 97 S&P 500 reports still to come is for an earnings decline of -2.8%, which compares to +2.1% earnings growth for the same group of companies in the preceding quarter. The composite growth rate for Q1, where we combine the results of the 405 companies that are out with the 97 still to come, is for a rise of +1.7% in total earnings on -1% lower revenues. In terms of dollar earnings levels, composite earnings in Q1 total $249.9 billion, a new quarterly record, surpassing the prior high mark of $245.8 billion in Q1 2012. This will be the highest quarterly total since the current earnings cycle started back in 2009 (is that why the market is at a new all-time high as well?).

Expectations for the coming quarters have started coming down, though they still represent a material improvement in the earnings picture. Total earnings in 2013 Q2 are now expected to be up +1.7% on -0.2% lower revenues. This is a drop from the +3.9% total earnings growth expected in Q2 on +0.5% higher revenues less than four weeks ago.

A similar though less pronounced downward adjustment process has gotten underway for the second half of the year as well. Current expectations are for total earnings growth of +5.9% (down from +7.6% in early April) in 2013 Q3 and +13.6% (down from +14.3% in early April) in Q4. For full years 2013 and 2014, total earnings are expected to be up +6.1% (down from +6.8%) and +11.3% (down from +11.7%).

The economic calendar is on the thin side this week, with no top-tier economic data coming out. It will be interesting to see if the market can maintain its positive momentum in an otherwise low-news period.

Monday – 5/6
Nothing on the economic calendar.
Tyson Foods (TSN) is the only major report in the morning, while Anadarko Petroleum (APC), First Solar (FSLR), Vornado Realty (VNO) and Zacks Focus List member P.S. Business Parks (PSB) will report after the close.

Tuesday – 5/7
Nothing major on the economic calendar, but a busy day on the earnings front, particularly after the close.
EOG Resources (EOG), Fossil (FOSL) and Steven Madden (SHOO) are the notable reports in the morning, while Disney (DIS), Whole Foods (WFM), TripAdvisor (TRIP), Electronic Arts (EA) and Zillow (Z) are the key reports after the close.

Wednesday – 5/8
Nothing on the economic calendar.
News Corp (NWSA), Groupon (GRPN), Transocean (RIG) and Green Mountain Coffee (GMCR) are the key reports today, all after the close.

Thursday – 5/9
Weekly Jobless Claims and March Wholesale Inventories are the key reports in the morning.
Dean Foods (DF), Apache (APA), Cooper Tire (CTB) and Dish Network (DISH) will report in the morning, while Priceline (PCLN) will report after the close.
Zacks ESP, our proprietary leading indicator of earnings surprises, is showing Dean Foods, Cooper Tire and Dish Network coming out with positive earnings surprises.

Friday – 5/10
Nothing major on the economic calendar. Arcelor Mittal (TMT) and Beacon Roofing (BECN) are the key reports today, both in the morning.

Earnings Preview 04/26/2013: Grading the Q1 Earnings Season

by Sheraz Mian
April 26, 2013

We have crossed the halfway mark in the Q1 earnings season, with results from 271 S&P 500 companies already out (as of Friday, April 26th). Please note that these 271 companies are more than just 54.2% of the index’s total membership – they account for 65.9% of the index’s total market capitalization and bring in 67.8% of all Q1 earnings. In other words, while there are still plenty of reports to come, we have seen roughly two-thirds of Q1 earnings already.

This week brings in results from 844 companies, including 129 S&P 500 members. This includes operators like Pfizer (PFE), Eaton Corp (ETN), Cummins (CMI), Time Warner (TWX) and many others. By the end of this week, we will have seen Q1 earnings reports from 80% of the S&P 500 members.

We have seen enough Q1 earnings reports by now to be able to judge it with a fair amount of confidence. So what is the judgment then?

I would grade the Q1 earnings season as between ‘average’ and ‘below average’ – it’s definitely neither ‘good’ nor ‘bad.’ This isn’t materially different from what we have been seeing over the last few earnings seasons. What this means is that about two-thirds of the companies beat earnings expectations, but growth is essentially non-existent. A key difference relative to 2012 Q4 earnings season is the very low level of positive revenue surprises.

The Q1 Earnings Scorecard

Total earnings for the 271 companies that have reported results already are up +2.5%, with 67.9% of the companies beating earnings expectations with a median surprise of +3.2%. Revenues are down -1.45%, with only 38% of the companies coming ahead of top-line expectations, with a median surprise of (negative) -0.4%.

The earnings growth rate and ‘beat ratio’ (% of companies coming out with positive surprises) for these 271 is comparable what these same companies reported in 2012 Q4 and the last few quarters. But the revenue growth rate and ‘beat ratio’ is lower, with the beat ratio particularly weak in the current period.

In addition to the revenue weakness, another notable aspect of the Q1 earnings season has been the soft Technology results. The sector’s growth rates and ‘beat ratios’ are weaker than the same for the S&P 500 as well as the group reported in 2012 Q4. With 80.8% of the sector’s total market capitalization already out with Q1 results, total earnings for the sector are down 3.1%, with 61.9% of the sector companies beating earnings expectations (vs. the S&P 500 average of 67.9%). The revenue side for the sector isn’t that bad, which goes on to spotlight the sector’s margin problems.

The aggregate earnings picture for the 229 S&P 500 reports still to come is for an earnings decline of -1.8%, which compares to +3.8% earnings growth for the same group of companies in the preceding quarter. The composite growth rate for Q1, where we combine the results of the 271 companies that are out with the 229 still to come, is for a rise of +1.4% in total earnings on -0.2% lower revenues.

Earnings will have plenty of competition for the market’s attention as the week is full of top-tier economic reports. The most important report of the week will be the April non-farm payroll report coming out on Friday, but the two ISM report and the March Personal Income & outlays reports will be equally important. Economic data lately has been overwhelmingly disappointing, though it hasn’t really mattered that much with investors given their reliance on the Fed to keep supporting the market.

This week also brings a lot of central bank action, with meetings of the FOMC and the ECB (European Central Bank). The Fed may not do much other than just acknowledge the recent negative tone of economic data, but expectations remain high that the ECB will announce a rate cut. Mario Draghi has thus far been resistant to the idea due to German pressures. But with even the German economy now showing signs of strain, he may finally relent. Bottom line, we will have a very busy week on the economic front.

Monday – 4/29

We will get the March Personal Income & Outlays report in the morning, with expectations of a 0.4% increase in income (vs. +1.1% in February) and +0.1% increase in spending (vs. +0.7% in February). This report will have a big bearing on how much the Q1 GDP growth rate will get revised.
Eaton (ETN) and Loews Corp (L) are the major reports in the morning, while Newmont Mining (NEM) and Express Scripts (ESRX) will report after the close.

Tuesday – 4/30

The two-day FOMC meeting gets underway today, while the February Case-Shiller Home Price index and the April Consumer Confidence survey will come out in the morning, after the market open. Also coming out is the April Chicago PMI, which has historically had a strong track record of foretelling the national Manufacturing ISM survey.
Pfizer (PFE), Cummins (CMI), Avon Products (AVP), Valero Energy (VLO) and Archer Daniels-Midland (ADM) are the key earnings reports.

Wednesday – 5/1

Manufacturing ISM, ADP jobs and the FOMC statement are the key economic reports.
The April ADP jobs report before the market open will give us a preview of what to expect from Friday’s non-farm payroll report from the BLS. The consensus expectation is for 170K private sector jobs in the ADP report, up from March’s 158K tally.
The ISM reading is expected to drop to 50.9 from March’s 51.3 level.
Mastercard (MA), Visa (V), Merck (MRK), Humana (HUM), Time Warner (TWX), Allstate (ALL) and CBS (CBS) are some of the key reports in the morning on a very busy earnings day, while Facebook (FB) will be the key attraction after the close.

Thursday – 5/2

Jobless Claims, March Trade balance, and Q1 productivity will be the key reports in the morning.
A very busy day on the earnings front, with Kellogg (K), Cigna (CI), Estee Lauder (EL), International Paper (IP) and the CME Group (CME) will report in the morning, while Kraft Foods (KRFT) and AIG (AIG) will report after the close.

Friday – 5/3

We will get the April non-farm payroll report in the morning, with expectations of 160K ‘headline’ jobs, up from March’s 88K tally. The unemployment rate is expected to remain unchanged at 7.6%.
The non-manufacturing ISM report will also be coming out, with expectations of a 53.5 reading vs. March’s 54.4 level.
ADP (ADP), Moody’s (MCO), Newell Rubbermaid (NWL) are the key reports toda

Earnings Preview 04/19/2013: Into the Heart of Q1 Earnings Season

by Sheraz Mian
April 19, 2013

There is an air of disappointment in the market about the ongoing Q1 earnings season. Some of it is justified. After all, what else should investors think when companies like IBM (IBM) and GE (GE) come up short? Results from the Technology sector have been underwhelming and the revenues overall have been on the weak side.

That said, the reality is that Q1 results aren’t materially weaker than what we saw in the 2012 Q4 earnings season. The market seemed satisfied, if not exactly thrilled, with Q4 results, as its strong momentum in January and February this year shows.

What this means is that the excessive hand-wringing may not solely be due to Q1 results, but rather what these results tell us about the coming quarters. Consensus expectations for the first half of 2013 appear quite reasonable, with total earnings for companies in the S&P 500 expected to increase by only +1.2% from the same period in 2012. But estimates for the back half of the year represent a significant growth ramp up — +10.8% over the 2012 period.

Consensus estimates then extrapolate the expected second-half 2013 growth recovery into 2014, resulting in further gains of +11.7%. Recent economic data from home and abroad is likely prompting a reassessment of these earnings growth expectations. The earnings miss from IBM and GE’s reference to Europe bring home this issue.

We are hardly being premature in drawing these conclusions from the Q1 results we have seen thus far. After all, the 104 S&P 500 companies that have reported results already (as of Friday, April 19th) represent 1/3rd of the total market capitalization of the index. We will get a deluge of earnings reports this week, with a total of 665 companies coming out with Q1 results, including 162 S&P 500 members. This includes a host of industry leaders from Apple (AAPL) and Amazon (AMZN) to DuPont (DD), Caterpillar (CAT) and Ford (F).

The Q1 Earnings Scorecard

The Scorecard for the 104 companies that have reported results show total earnings growth of +4.6%, with 69.2% of the companies beating earnings expectations with a median surprise of +3.2%. Revenues are up +3.4%, with only 35.6% of the companies coming ahead of top-line expectations, with a median surprise of (negative) -0.3%.

The earnings growth rate and earnings ‘beat ratio’ (% of companies coming out with positive surprises) for these 104 is better than what these same companies reported in 2012 Q4. But the revenue growth rate and ‘beat ratio’ is lower, with the beat ratio particularly weak in the current period.

Technology results have been on the weak side thus far. We will find out more this week as Apple and Amazon report results, but the Tech companies that have reported already account for 46% of the sector’s total market capitalization. Only 64.3% of the Tech companies have beaten Q1 earnings expectations thus far, weaker than the earnings ‘beat ratio’ for the S&P 500 as a whole of 69.2% and the 78.6% ‘beat ratio’ for the same group of companies in Q4.

The revenue side is even weaker, with only 35.7% of Tech companies coming ahead of top-line expectations, roughly in-line with the S&P 500 as whole, but materially weaker than the group’s revenue ‘beat ratio’ in Q4.

The aggregate earnings picture for the 396 S&P 500 reports still to come is for earnings decline of -4.3%, which compares to +2.1% earnings growth for the same group of companies in the preceding quarter. The composite growth rate for Q1, where we combine the results of the 102 companies that are out with the 398 still to come, is for a drop of -0.8% in total earnings on flat revenues.

Earnings will be the focus all week, though we have a fair number of economic reports on the docket as well. The most important of the economic reports is the first read on the Q1 GDP that comes out on Friday. Most of the monthly economic data for March showed that the economy lost momentum that month after the strong gains in the first two months of the quarter.

Unfortunately, the GDP report on Friday will be mostly reflecting what happened in January and February, with subsequent revisions adjusting for the March slowdown. As such, odds are high that we could get a very strong number – higher than the +3% currently expected. GDP aside, we will get the March Durable Goods and New Home Sales data as well.

Monday – 4/22

We will get the March Existing Home Sales numbers after the market opens, with expectations of improvement from February’s 4.98 million level.
Caterpillar (CAT) and Halliburton (HAL) are the key earnings reports in the morning, while Texas Instruments (TXN) and Netflix (NFLX) will report after the close.
Citigroup (C) and Charles Schwab (SCHW) are the only major reports today, both before the open.

Tuesday – 4/23

We will get the March New Home Sales data after the market opens, with expectations of 421K vs. 411K in February.
Apple is the major earnings report coming out after the close. The key reports in the morning session are from DuPont (DD), Coach (COH), Travelers (TRV) and Discover Financial (DFS). In addition to Apple, we will have reports from AT&T (T) and Yum Brands (YUM) after the close.
Zacks ESP, our proprietary leading indicator of earnings surprises, is showing Travelers coming out with an earnings beat.

Wednesday – 4/24

We will get the March Durable Goods orders report in the morning, with expectations of a decline after the strong gain in February. March economic data has been overwhelmingly weak, and this report is expected to further confirm that trend.
Boeing (BA), Ford (F), Eli Lilly (LLY), Procter & Gamble (PG), T Rowe Price (TROW) and Sprint (S) are the major reports in the morning, while Qualcomm (QCOM) is the major report after the close on a very busy earnings day.
Eli Lilly’s Zacks Rank #3 (Hold) and ESP of +3.85% shows that the company is expected to come out with a positive surprise.

Thursday – 4/25

Jobless Claims is the only major economic report this morning.
A very busy day on the earnings front, with Exxon (XOM), 3M (MMM), ConocoPhillips (COP), Diamond Offshore (DO), UPS (UPS), Dow Chemical (DOW), Southwest Air (LUV) and Pulte (PHM) will report in the morning, while Amazon (AMZN) and Starbucks (SBUX) will report after the close.
Zacks ESP is showing Amazon, Dow Chemical and Diamond Offshore coming out with positive earnings surprises.

Friday – 4/26

We will get the first read on the Q1 GDP, with consensus expectations of +3% gain after the +0.4% growth in 2012 Q4.
Chevron (CHV), Total (TOT), D.R. Horton (DHI) and National Oilwell Varco (NOV) are the key reports today, all in the morning.

Read this article on Zacks.com
Zacks Investment Research

Screen of the Week 04/16/2013: Profit Margins Will Determine Your Portfolio’s Bottom Line

by Kevin Matras
April 16, 2013

This week I want to focus on Sales Growth and Profit Margins.

While everybody understands sales, margins might bring up a few question marks.

So let’s start at the beginning: first and foremost, sales are THE most important thing to a company. Everything else stems from that. Without sales, there really wouldn’t be anything else to analyze. And Sales Growth numbers show you how that company is growing.

However, just because sales are increasing doesn’t always mean that profits are increasing too. Sales at the expense of profits does not work. So paying attention to Profit Margins is the next thing we’re going to want to look at.

Margin is simply a ratio and the calculation is:

Net Income divided by Sales

So if a company’s margin is 15% for instance, that means its net income is 15 cents for every $1 dollar of sales it makes.

But if a company’s expenses are growing faster than their sales, this will reduce their margins.

In general, a company with increasing margins is becoming more profitable and is better managed, i.e., their costs are under control.

So continue to look at their sales numbers. And of course, look at their earnings too. But take a look at their profit margins as well. Are they going up or down? In other words, are they making more money on each dollar of sales they make, or less? This is important stuff to know, and can make a huge difference in your portfolio’s bottom line.

Parameters for this week’s screen:

12 Month Trailing Sales Growth (Current / 1 Quarter Ago) greater than their relevant Industry median (Looking for the top companies in their industries.)

Current Net Margin greater than or equal to 5 Yr. Avg. Net Margin (Steady to increasing Net Profits is what we’re after.)

Current Net Margin greater than or equal to Net Margin from 1 Quarter Ago (If a company’s profit margin fell last quarter, there’s a chance it might fall yet again. So we’re excluding those companies whose margins fell in the previous quarter.)

Zacks Rank equal to 1 (Strong Buy)
(Only the top Zacks Ranked stocks can get thru.)

Here are 5 stocks that passed this screen this week:

(EXR) Extra Space Storage Inc.
(HF) HFF, Inc.
(LCI) Lannett Company, Inc.
(MCO) Moody’s Corp.
(WRB) W.R. Berkley Corp.

Sign up now for your 2 week free trial to the Research Wizard and start adding these values to your own screening strategies. Or start following this screen’s winning picks in your own portfolio. Don’t wait.

Learn how today.

Disclosure: Officers, directors and/or employees of Zacks Investment Research may own or have sold short securities and/or hold long and/or short positions in options that are mentioned in this material. An affiliated investment advisory firm may own or have sold short securities and/or hold long and/or short positions in options that are mentioned in this material.

Read the full Analyst Report on WRB
Read the full Analyst Report on MCO
Read the full Snapshot Report on LCI
Read the full Snapshot Report on HF
Read the full Snapshot Report on EXR

Earnings Preview 04/05/2013: Econ Data Turns Market Bearish

by Sheraz Mian
April 05, 2013

The market’s mood appears to have shifted following the recent run of weak economic data, with investors grudgingly acknowledging that the economy may not be in as good a shape as everybody had expected. May be it’s the typical seasonal weakness that we have become accustomed to in recent years, or maybe it’s the delayed impact of the budget sequester and other tax law changes. It will take the market some time to figure that one out, but we have the 2013 Q1 earnings season to keep us busy.

The Q1 earnings season has started already, with reports from 22 S&P 500 companies already out. It has been a mixed bag thus far, with a few notable misses from the likes of Oracle (ORCL), FedEx (FDX), ConAgra (CAG) and others. But this is still quite early in the season, and we wouldn’t get a good flavor of this reporting cycle for another two to three weeks.

This week brings in earnings reports from 34 companies, including 9 S&P 500 members. We will get Alcoa’s (AA) report after the close on Monday, but will have to wait till Friday morning to get the week’s key reports from J.P. Morgan (JPM) and Wells Fargo (WFC).

In terms of earnings growth, the banks are facing tough comparisons, as results in the first quarter of 2012 were very strong. The challenge for the group is to balance the net interest margin pressures and muted loan growth with continued momentum on the mortgage side and a healthy enough capital markets business. Wells Fargo and J.P. Morgan are both among the better-placed of their peers; many others are not so well positioned.

We will have to wait another week to get a good sense of banking sector results, but expectations are for total Finance sector earnings to decline by -3.8%, which would come after the sector’s +10.3% +23.3% earnings growth in the preceding two quarters, respectively. Tough comparisons are a major culprit here — the first quarter of 2012 was the strongest quarter for the sector since 2009.

In absolute dollar terms, the Finance sector’s profitability level in the first quarter of 2013 is the second best after the first quarter of 2012. The unfavorable comparison aspect is particularly pronounced for AIG (AIG) and Bank of America (BAC). Excluding these two companies, total Finance sector earnings would look better.

Total earnings for companies in the S&P 500 are expected to be down -2.6% from the same period last year, which reflects -2.4% decline in revenues and essentially flat margins. Tough comparisons account for the bulk of the weak growth outlook for the first quarter – the first quarter of 2012 still remains the highest point for quarterly earnings since the start of this earnings cycle in 2009. Total earnings were up +2% in the fourth quarter.

Unlike the concentrated weakness in Finance, the -5.7% decline in Tech sector earnings is relatively broader-based, but is still heavily concentrated in Apple (AAPL), Intel (INTC) and Seagate Technology (STX), partly offset by strength at Microsoft (MSFT). But even if we exclude these four companies from the Tech sector’s first quarter tally, earnings growth would still be negative at -2.9%.

Investors don’t seem to be overly concerned about lack of earnings growth in the first quarter as they are looking ahead to the resumption of growth later this year. The consensus view is that earnings growth in the first half of 2013 will be flat, but they are looking for +9.5% growth in the back half of 2013 and full-year 2014. And as long as that outlook remains intact, they will remain content with a weak growth pace in the first quarter.

But it will likely get harder to stick to that outlook if companies can’t provide reassuring guidance for the rest of this year. We haven’t seen much positive guidance over the last two quarters, but companies will have to do a bit better this time around if current expectations for the remainder of the year are to hold up.

Monday – 4/8

There is nothing major on the economic calendar.
The major earnings report today is Alcoa’s (AA) release after the close.

Tuesday – 4/9

No first-tier economic data on the docket today either.
PriceSmart (PSMT) is the only notable earnings report today, coming out after the close.

Wednesday – 4/10

We will get minutes of the Fed’s March meeting in the afternoon. It will be interesting to get another flavor of the FOMC’s internal debate on the future of QE. But following Friday’s weak jobs data and the two the underwhelming ISM reports for March, those March FOMC debate may no longer be that relevant today.
We have the first relatively busy day of the Q1 earnings season, with reports from Bed, Bath & Beyond (BBBY), CarMax (KMX), Fastenal (FAST), Family Dollar (FDO) and Constellation Brands (STZ), all in the morning.

Thursday – 4/11

The Jobless Claims data is the key number today, particularly after last week’s surprise jump. If we don’t see a reversal of the prior week’s rise, then it would be further confirmation that the spring slowdown had started taking effect. The two ISM surveys, the ADP report, and then Friday’s March non-farm payroll report all pointed in that direction.
Commerce Bancshares (CBSH), Pier 1 Imports (PIR) and Rite Aid (RAD) are the major earnings reports today, all in the morning.

Friday – 4/12

We will get the March Retail Sales, PPI, and the Michigan Consumer Sentiment survey today. The Retail Sales report will be particularly notable as the prior month’s data was particularly strong. But the March jobs report showed a major decline in retail jobs, likely reflecting the impact of tax law changes.
J.P. Morgan (JPM) and Wells Fargo (WFC) are the key reports today, both in the morning.
Zacks ESP, our proprietary leading indicator of earnings surprises, is showing JPM coming out with an earnings beat.

Screen of the Week 04/02/2013: Your Next Stock Should Be Making New Highs

by Kevin Matras
April 02, 2013

Today I’m going to go over a simple screen with a powerful concept.

Buying stocks making new highs.

I know some are reluctant to buy stocks making new 52 weeks highs. If you’re one of them, have you ever asked yourself why?

If a stock is making a new 52-week high, that’s a good thing. Especially now.

I’m pretty sure that a person who dislikes buying stocks making new 52-weeks highs wouldn’t be too upset if the stock he already owned broke out to new 52-week highs.

And why should he? Statistics have shown that stocks making new highs have a tendency of making even higher highs.

These are the stocks we all dream about. Get in and it keeps going up.

Of course the fundamentals need to be there. And you should keep a watchful eye on valuations. But if you were in a stock making new highs and cheering it on, it seems silly to be afraid of one doing the same just because you haven’t bought it.

One question I like asking myself just to put things into perspective is: if I was in it, would I be excited and would I still want to be in it? If the answer is yes, then I’ll look for the best opportunity to get in.

If the answer is no, that I’d want to take profits, then I’ll move on.

This topic actually reminds me of a question someone asked me a while ago about a stock I was talking about that was at a new 52-week high. In fact, it was at a new 5 year high.

He said aren’t you worried about buying a stocks at a 52-week high? I said of course not. So it just made a new-52 week high. That’s great news. Guess what — last year it made a new 52-week high as well. And the year before that. And the year before that.

Can you imagine all the money you’d be leaving on the table if you were afraid of being in stocks every time they made a new high?

The screen I’m running today looks for:

Stock trading within 10% of their 52 week high. The expression looks like this:

Current Price/52 Week high greater than or equal to .90

That means these stocks are either at a new 52 week high, or have just hit it and still trading within 10% of it, or are climbing towards their 52 week high and are within striking distance.

Zacks Rank less than or equal to 2

Only Zacks Strong Buys and Buys.

Price to Sales less than or equal to 1

A Price to Sales ratio of 1 means you’re paying $1 for every $1 of sales a company makes. A P/S ratio of less than 1 means you’re paying less than $1 for every $1 of sales a company makes. I have found that by looking at stocks with a P/S ratio of less than or equal to 1 helps me find stocks that are still considered undervalued -– even if they are making new highs.

Current Avg. 20 Day Volume greater than Previous week’s Avg. 20 Day Volume

In short, this helps me find stocks where the volume has increased in the recent week vs. the previous week. If the price is climbing on increased volume, that shows increased demand or buying coming in. And the more buying demand there is for a stock, the more it should climb.

All of these parameters are applied to stocks greater than or equal $5 with Avg. daily volume of greater than or equal to 100,000.

Here are 5 stocks that made it thru this week’s screen:

(GPK) Graphic Packaging Holding Co.
(LNDC) Landec Corp.
(AIZ) Assurant Inc.
(CVS) CVS Caremark Corp.
(GIII) G-III Apparel Group, Ltd.

Sign up now for your 2 week free trial to the Research Wizard and get the rest of the stocks on this list and start using this screen in your own trading. Or create your own strategies and test them first before you invest. Know what to buy and when to sell. You can do it.

Learn how today.

Disclosure: Officers, directors and/or employees of Zacks Investment Research may own or have sold short securities and/or hold long and/or short positions in options that are mentioned in this material. An affiliated investment advisory firm may own or have sold short securities and/or hold long and/or short positions in options that are mentioned in this material.

Read the full Snapshot Report on LNDC
Read the full Snapshot Report on GPK
Read the full Snapshot Report on GIII
Read the full Analyst Report on CVS
Read the full Analyst Report on AIZ